
One of the Largest Survey Panel in Japan
With more than 10 million panelists, segmented into roughly 20 categories covering demographics, lifestyle, and purchase behavior (e.g., seniors, mobile‑phone users, car owners, cosmetics users), we can handle studies from massive general‑population surveys to highly selective niche targets. Partner panels add even more reach.
Whatever the scale or specificity of your internet‑research needs, Cross Marketing can deliver. Contact us to discuss your next project.
One of the largest survey panel in Japan, with more than 10 million respondents


Experts Provide Full Support—from Planning to Reporting
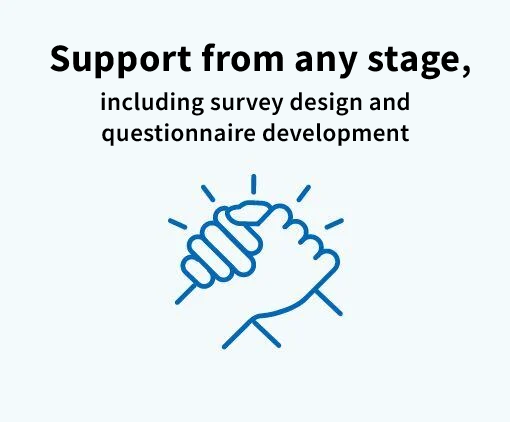
Even first‑time users receive full, end‑to‑end assistance.

Our dedicated researchers have deep marketing‑research expertise and proven field experience.
They support you through every step—from identifying business issues to designing the study, analyzing data, and delivering the final report.
- Typical concerns we solve:
- “I’m only vaguely considering research—where do I start?”
- “I’m not sure which research approach fits my objectives.”
- “We lack the right analytical methodology in‑house.”
- “Creating a report internally is difficult.”
A full‑time researcher will guide you, so you can proceed with confidence even if your in‑house resources are limited.


Tokyo Metro Co., Ltd.
By employing multiple research methods to comprehensively understand needs, we deliver high-quality services to Tokyo Metro users.
Industry/Sector:
Travel, Tourism,Transportation
Support Areas:
Marketing Research, Self-Service Research

Mitsubishi Shokuhin Co., Ltd.
Uncovering the essence of consumers through a combination of quantitative and qualitative research over four years.
Industry/Sector:
Food and Beverage
Support Area:
Marketing Research

The Japan Association for Public Opinion Research (JAPOR)
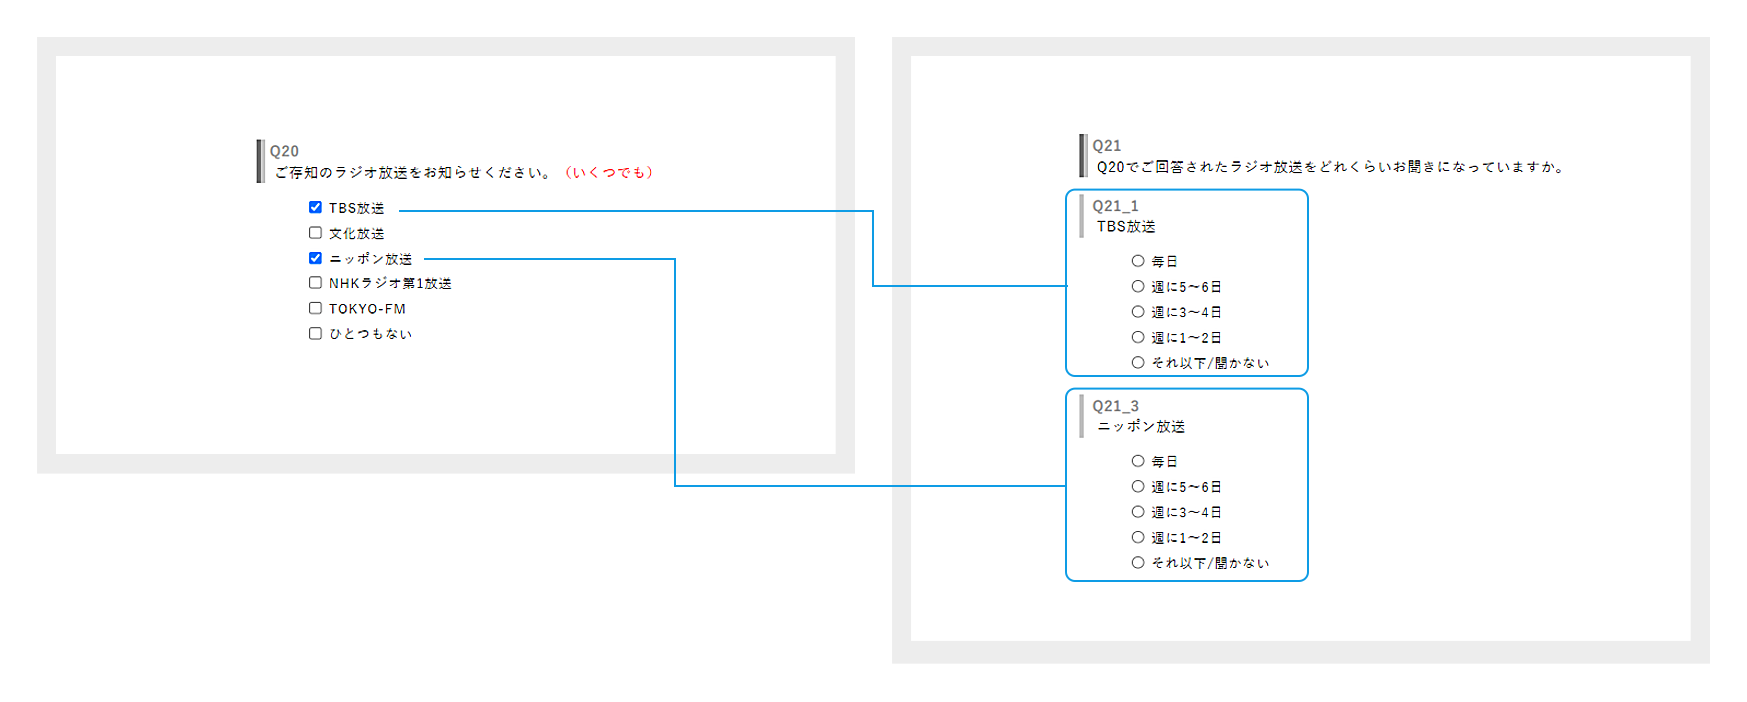
Effortlessly execute complex questionnaire designs. The key to success lies in close communication.
Industry/Sector:
Academia, Research, and Education
Support Area:
Marketing Research