

Survey on Gaming (2026) - Console Games
2026 / 07 / 14
This survey covers two areas of gaming (console games and mobile games) and aims to clarify playing behavior, spending, and other aspects in order to capture the game market as a whole. This report covers console games.
Target: men and women aged 15-69 nationwide who play console games at least once a month, in all 47 prefectures of Japan. Sample size: 1,200. Fieldwork period: Wednesday, June 24 - Sunday, June 28, 2026.
◆Click here for the Mobile Games edition
https://www.cross-m.co.jp/en/report/20260722game
Download the report for free
*You can download the survey report from the "Report Download Form" at the bottom of this page.
- "Nintendo Switch" is the most used device at 40.5%, "Nintendo Switch 2" at 26.0%
Downloads and physical packages are almost neck and neck - Survey on Gaming (2026) - Console Games
Survey Result Topics
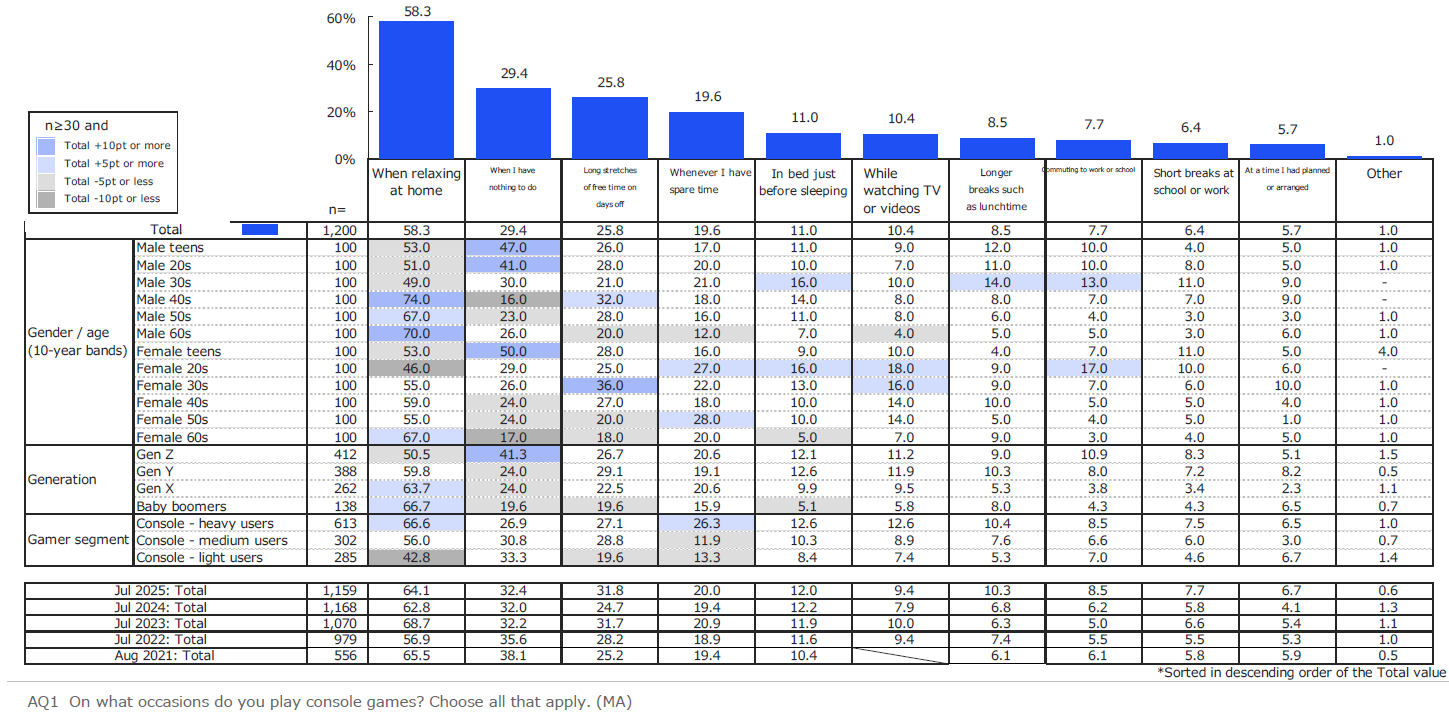
The most common occasions for playing are "when relaxing at home" (58.3%), "when I have nothing to do" (29.4%), and "when I have a substantial amount of free time on days off" (25.8%) overall. Among both men and women aged 15-19, "when I have nothing to do" is high (men aged 15-19: 47.0%; women aged 15-19: 50.0%).
<Figure 1>
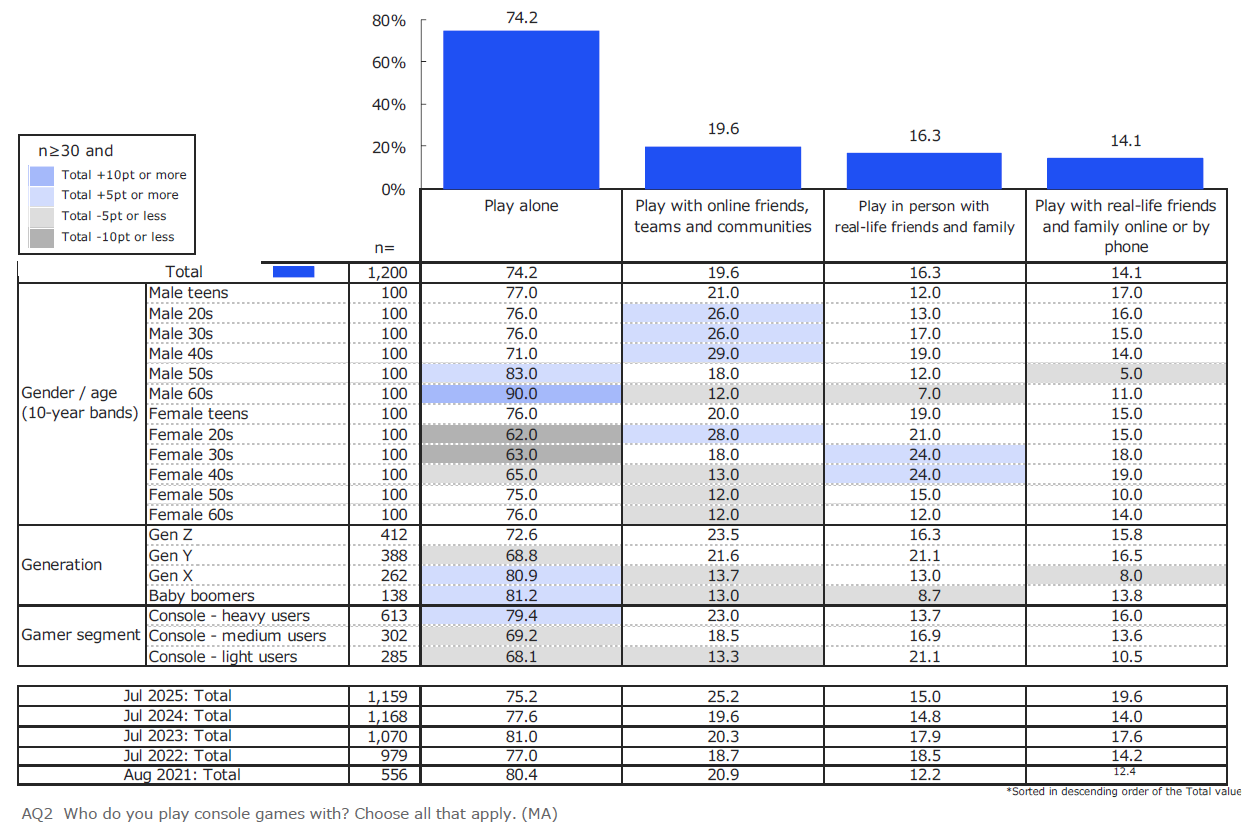
"Play alone" is the most common way of playing, at 74.2%. By gender and age, "play alone" reaches 90.0% among men in their 60s, higher than any other group. Men aged 20-49 are somewhat more likely to "play with online friends, teams and communities", while among women, online play leads only in their 20s; in their 30s and 40s, "playing in person with real-life friends and family" is slightly higher—a clear gender difference.
<Figure 2>
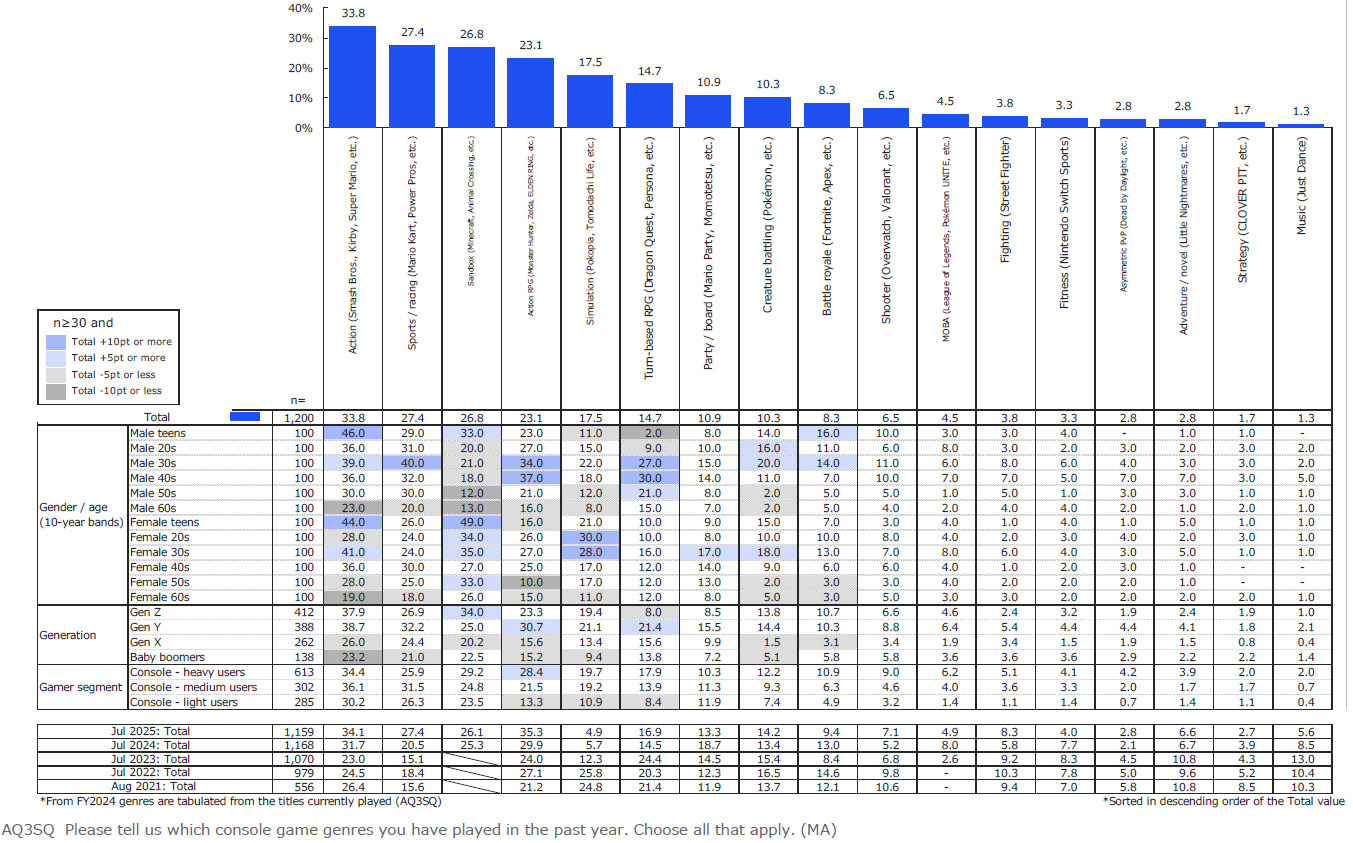
The most played genre is "action games" at 33.8%. By gender and age, play rates are highest among men aged 15-19 (46.0%) and women aged 15-19 (44.0%). The second most played genre, "sports / racing games", is high among men in their 30s, with 40.0% playing it. The third most played genre, "sandbox games", has a high play rate among women generally—especially women aged 15-19 (49.0%). The fourth most played genre, "action RPGs", has higher play rates among men in their 30s (34.0%) and 40s (37.0%) than in other age groups.
<Figure 3>
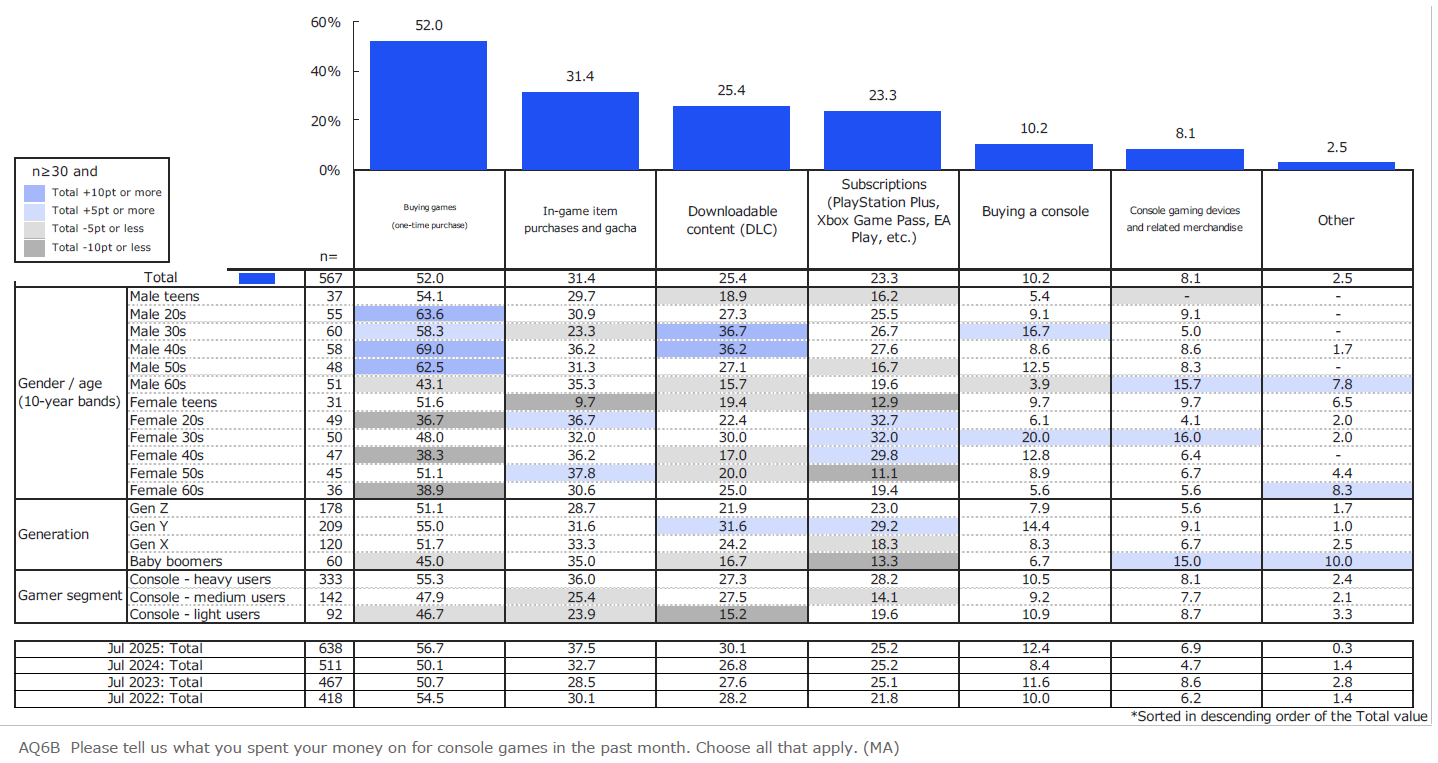
The most commonly used gaming device is the "Nintendo Switch" at 40.5%. Next comes "Nintendo Switch 2" at 26.0%, followed by "PC (Windows)" at 23.4% and "PS5" at 18.6%.
<Figure 4>
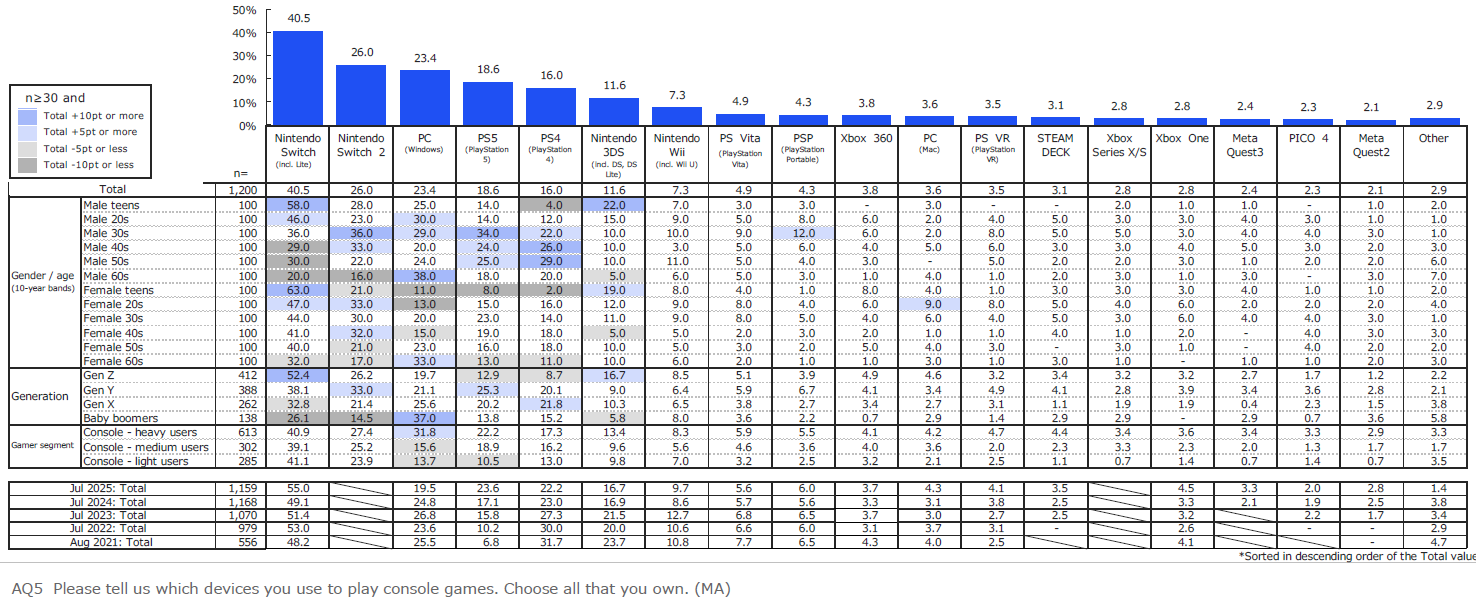
The leading reasons for playing console games are "it is a good way to kill time" (30.1%), "I simply like playing games" (28.4%), "there is a game title or series I like" (24.0%), "it relieves stress" (20.8%), and "I want to enjoy the story" (20.3%). By gender and age, women aged 15-19 tend to have a higher response for the less active reason "it is a good way to kill time" (42.0%) than other groups. Among both men and women in their 60s, "to maintain health and prevent aging" is somewhat higher (men in their 60s: 18.0%; women in their 60s: 13.0%).
<Figure 5>
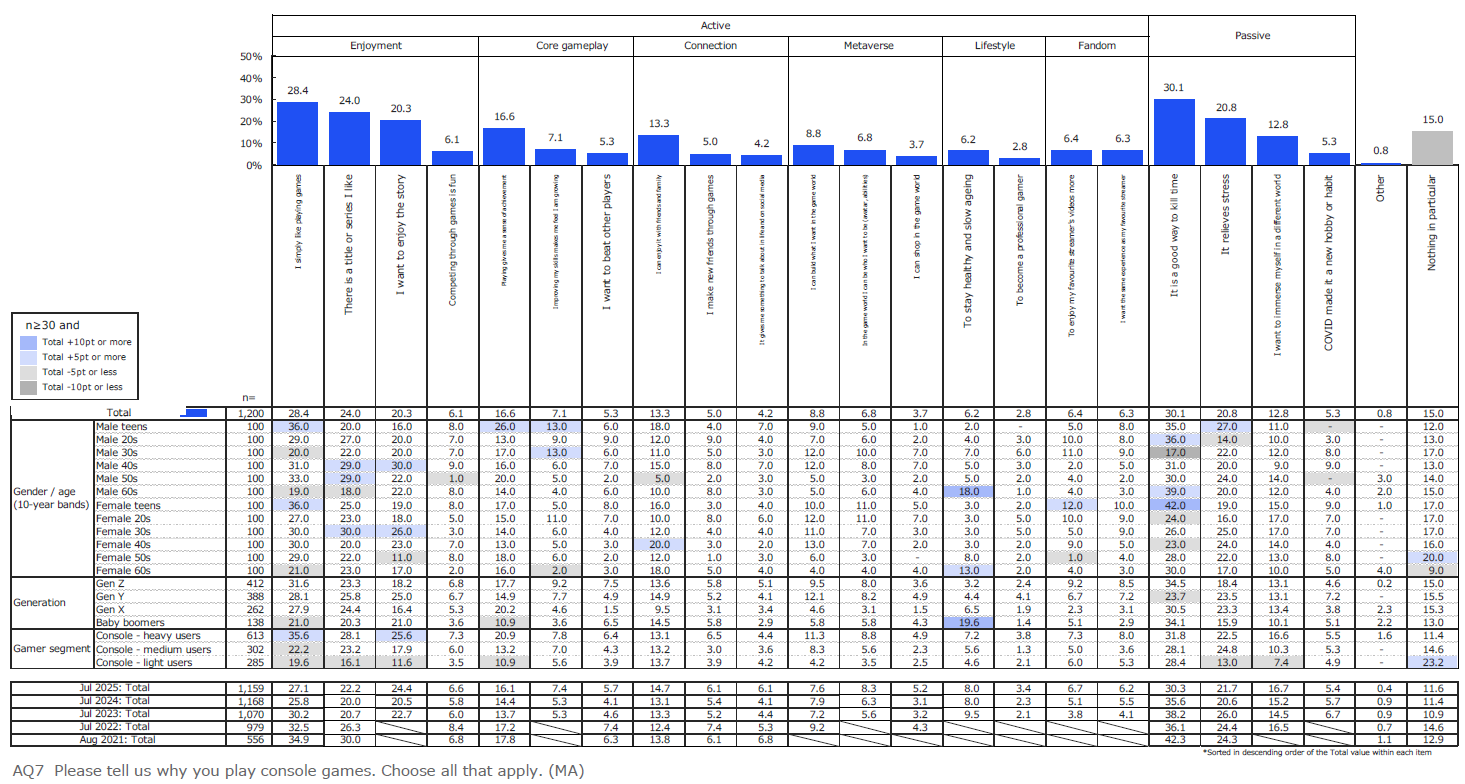
When choosing a console game, "it can be played for a long time" ranks first at 29.8%, followed by "it is a genre I like" (29.1%) and "it is free or inexpensive" (22.1%). Among game titles played in the past year, "Animal Crossing: New Horizons" was the most played title among women aged 15-19. In addition, "Tomodachi Life: Living the Dream" (released in April 2026) and "Pokopia" (released in March 2026) were also popular, indicating that a wider range of games that can be enjoyed for long periods and are popular among women has emerged as a feature of this year's market. Women in their 60s score more than 10 points higher than other groups on "it is free or inexpensive" (33.0%) and "the controls and rules are easy to understand" (29.0%), suggesting a preference for simple, light gameplay.
<Figure 6>
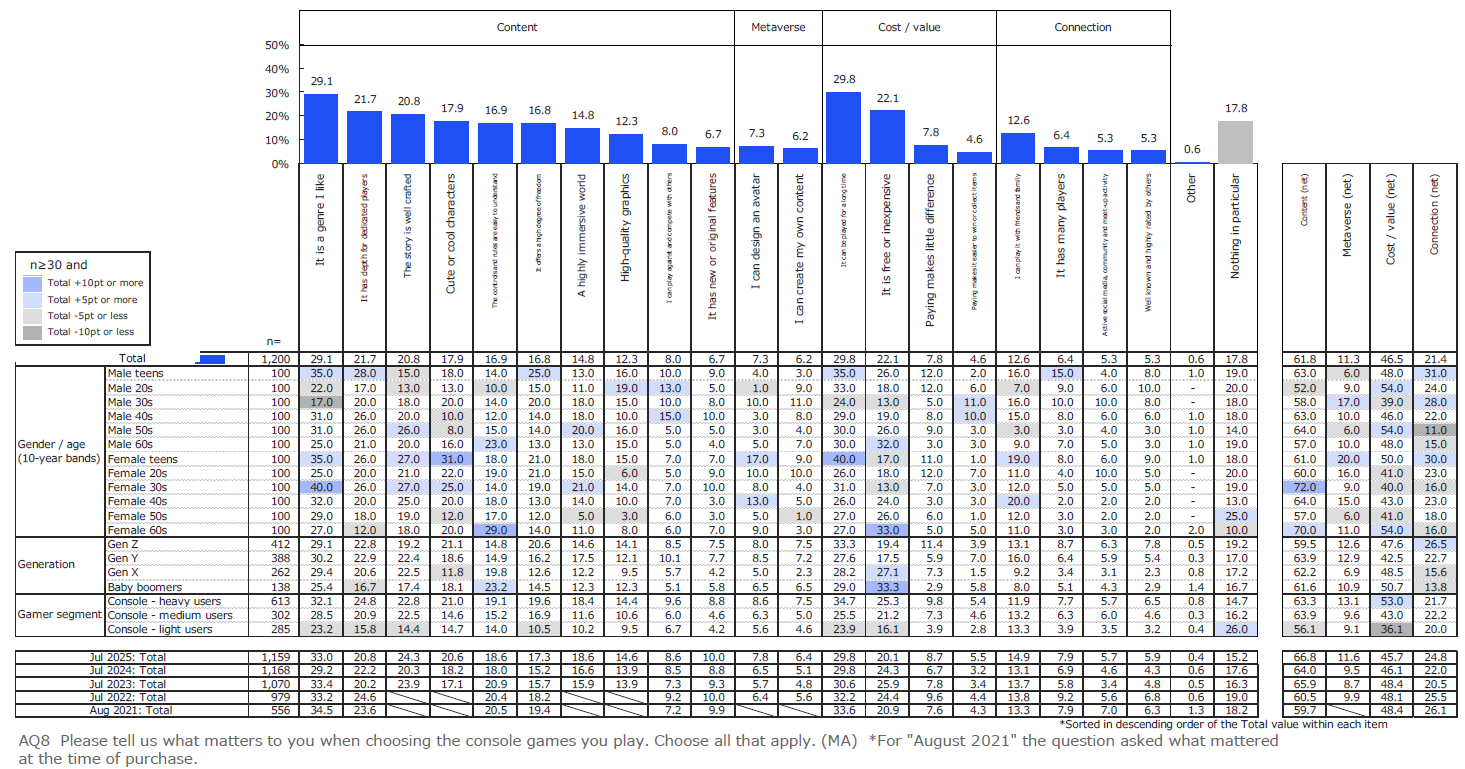
Among those who spent money on console games in the past month, "buying games (one-time purchase)" is the most common use at 52.0%. However, "in-game item purchases and gacha" (31.4%), "downloadable content (DLC)" (25.4%), and "subscriptions" (23.3%) show that spending also takes forms other than one-time purchases.
<Figure 7>
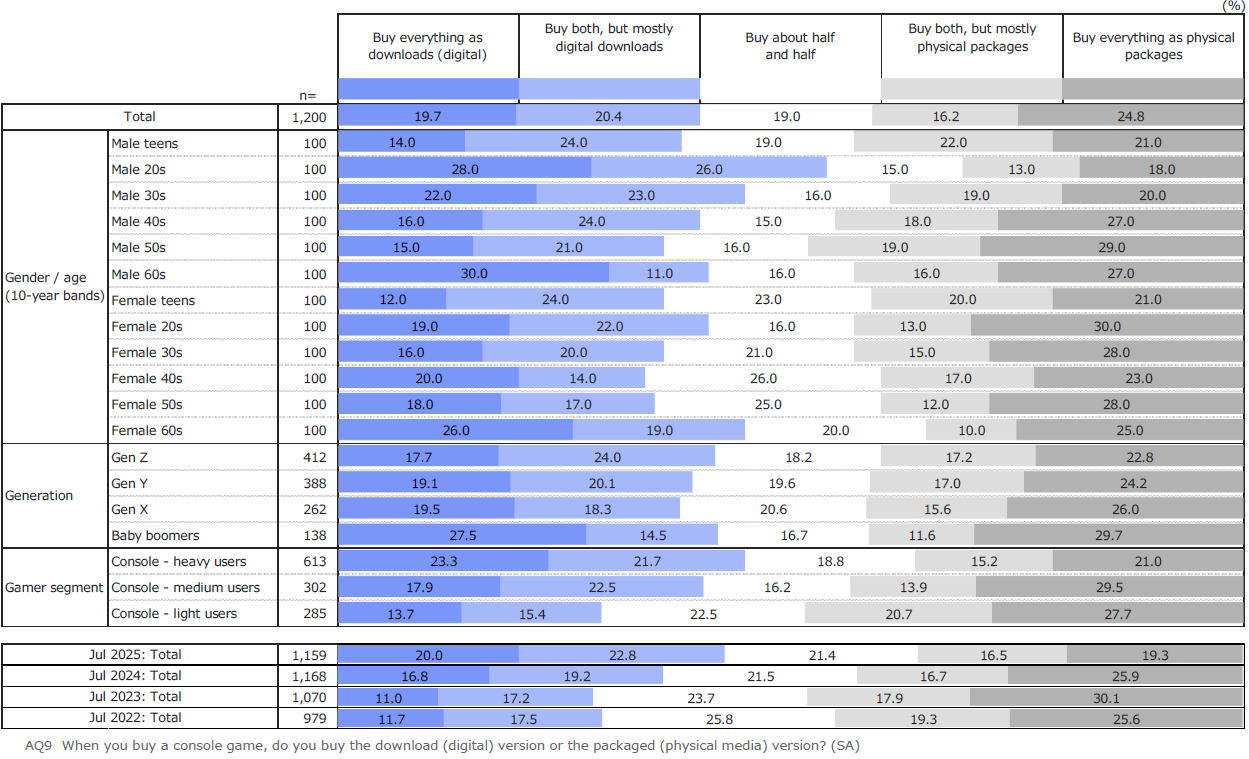
In terms of where games are purchased, "buy everything as physical packages" is highest at 24.8%, followed by "buy both, but mostly digital downloads" at 20.4%. Combining "everything" and "mostly", downloads account for 40.1% and physical packages for 41.0%, putting the two almost neck and neck. Among both men and women in their 60s, "buy everything as downloads (digital)" is somewhat higher than in other age groups and is the top answer within each group.
<Figure 8>
□ Survey design
□ Summary of results
□ Respondent profile
▼ Results (1) Profile of console game players
□ Console game play frequency
□ Play time on weekdays and days off
□ Change in console game play time over the past year
□ Change in console game spending over the past year
□ Media used to gather information about games
□ Media used to share and post information about games
▼ Results (2) Console gaming behaviour and attitudes
□ Occasions when playing console games
□ Who people play console games with
□ Console game titles played in the past year (overall ranks 1-60)
□ Console game titles played in the past year (overall ranks 61-100)
□ Console game titles played in the past year (by gender/age - male)
□ Console game titles played in the past year (by gender/age - female)
□ Genres of console games played in the past year
□ Console gaming devices currently used
□ Console game spending in the past month
□ How last month's console game spending was used
□ Reasons for playing console games
□ What matters when choosing a console game
□ Where console games are purchased
□ [Correspondence analysis] Genres of games played in the past year
□ Gaming Experience & Preferences
□ Gaming Experience & Preferences (Top 3 summary)
□ Disposable money for personal spending (per month)
▼ Reference
□ Cross Marketing's game research services
□ About Cross Marketing
Survey Overview
| Survey Method | Internet Research |
| Survey Region | 47 prefectures in Japan |
| Survey Target | Men and women aged 15-69 who play console games at least once a month |
| Survey Period | 2021: Friday, August 6 - Monday, August 9 2022: Friday, July 1 - Sunday, July 3 2023: Friday, July 7 - Monday, July 10 2024: Friday, June 28 - Tuesday, July 2 2025: Friday, June 27 - Thursday, July 3 2026: Wednesday, June 24 - Sunday, June 28 |
| Valid Responses | 2021: 556 samples in this survey 2022: 979 samples in this survey 2023: 1,070 samples in this survey 2024: 1,168 samples in this survey 2025: 1,159 samples in this survey 2026: 1,200 samples in this survey |
Note: Due to rounding, the composition ratio may not add up to 100% in the survey results.
Download the report for free
*You can download the survey report from the "Report Download Form" at the bottom of this page.
Credit Attribution for Citation and Reproduction
When citing or reproducing this release, please be sure to clearly credit our company as follows:
Example: "According to a survey conducted by Cross Marketing, a marketing research company..."
Contact Information for Media Inquiries
Public Relations: Marketing Department
Phone: 03-6859-1192
Email: pr-cm@cross-m.co.jp