Our experienced researchers will provide full support and propose the best research plan.
What is LINE Research?
LINE Research is a dedicated smartphone research platform provided by LINE Yahoo!
With approximately 6.85 million survey monitors (as of March 2024)—one of the largest in the industry—it allows for highly targeted survey distribution based on user attributes.
LINE Research is particularly strong in efficiently reaching students and young adults, a demographic often difficult to approach with conventional online research.
Now certified as a LINE Research Official Partner, Cross Marketing Inc. can offer an even broader range of research methods.


An interview with one of our researchers was published on LINE Corporation’s website!
LINE Research, which provides insights closer to real market conditions, fully supports your marketing actions.
Out of 6.85 million 10s-20s
50%
As of March 2024
Highly representative monitoring panel
About 96% of those aged 15–59 use a smartphone at least once a week, and about 97% use LINE. This high penetration rate makes LINE one of the most representative platforms for surveys across all age groups.
LINE Usage Rate
97%
*Source: LINE survey
On-site retention survey, conducted in April 2023, of smartphone users who use it at least once a week n=768
Fast collection via LINE
1,000 samples collected in 10 minutes
Because surveys are distributed via LINE push notifications, participants are quickly alerted and can respond promptly, resulting in high response rates.
*Timing depends on options selected and the number of distributed samples.

Fresh sample pool
Only 17% of LINE Research monitors are registered with three or more other survey services, making results more reflective of the general public.
Registration status with other survey services
3 or more registrations
17%of
3 or more registrations
46%of the total
Full support from dedicated LINE Research specialists
Our researchers are well-versed in LINE Research’s unique standards and smartphone survey methodologies, providing end-to-end support throughout your project.
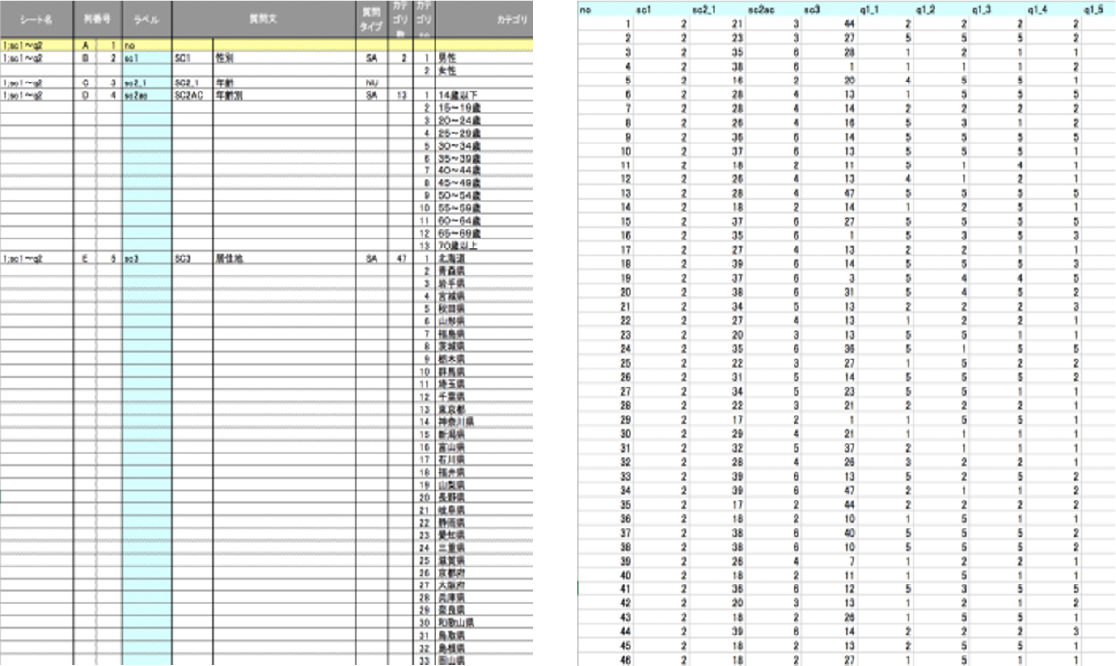
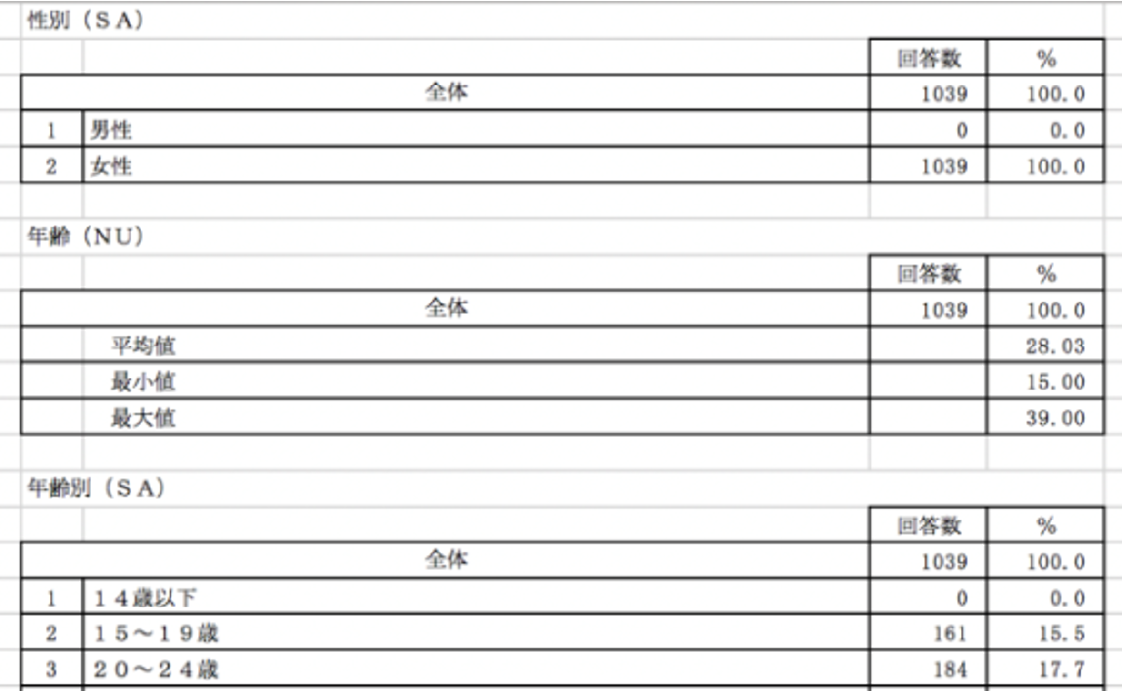
Delivery in Cross Marketing’s standardized data format
We perform data cleaning to our in-house standards and deliver raw data and GT tables in Excel format.
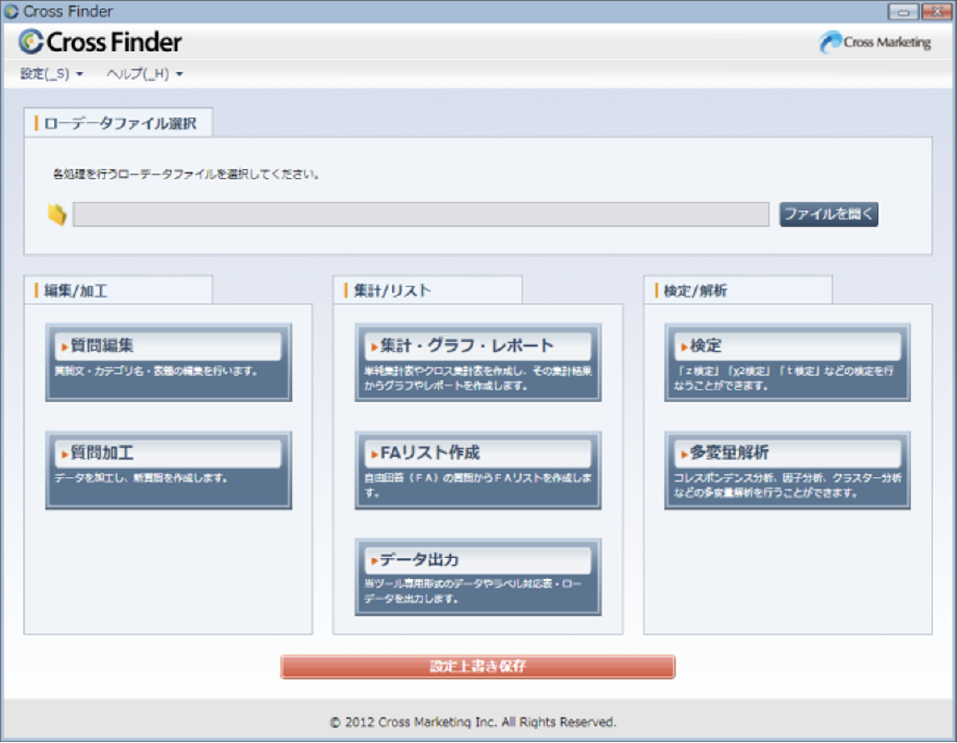
Free access to our tabulation tool, CrossFinder2
We provide data formatted for CrossFinder2, allowing clients to easily compile and analyze results independently at no additional cost.
Optional BI tools available for visualization
Survey results from repeated or fixed-point studies can be integrated and visualized using BI tools, enabling centralized data analysis.
Students

1,000 university juniors and seniors

300 junior high school students / 300 high school students
Young Adults (20s)
300 active nurses in their 20s
3,000 men and women in their 20s
Local/Area-Specific
300 residents of Kadoma City, Osaka
800 residents of Nagoya City, Aichi Prefecture
Available sub-panels as of December 2010

Our experienced researchers will provide full support and propose the best research plan.
Schedule may vary depending on the content, conditions, and requests.
Please contact our sales staff for more details. We’re happy to adjust timelines to fit your needs.
Deliverables
As with standard online research, we deliver data cleaned to our internal standards, with short respondent cut-off (responses under 3 seconds/question are removed; this is stricter than standard online research criteria).
We also provide CrossFinder2-compatible data free of charge.
- Included in Basic Fee
- Raw data, Simple tabulation (GT) tables, CrossFinder2-compatible data
- Optional Deliverables
- Crosstabulation tables, Survey reports
Basic Deliverables
*Click on the screen to enlarge.
Pricing Breakdown
Basic Charges
| Project Management Fee | 15% of the total pre-tax amount (*Prices do not include tax.) |
|---|
Screening fee
| Questions/ Number of Screenings | 5,000 ~5,000 | 10,000 | 20,000 | 30,000 | 40,000 | 50,000 |
|---|---|---|---|---|---|---|
| ~3 questions | 65,000 | 85,000 | 125,000 | 165,000 | 205,000 | 245,000 |
| ~6 questions | 95,000 | 130,000 | 200,000 | 270,000 | 340,000 | 410,000 |
| ~9 questions | 120,000 | 165,000 | 255,000 | 345,000 | 435,000 | 525,000 |
| ~12 questions | 145,000 | 200,000 | 310,000 | 420,000 | 530,000 | 640,000 |
| ~15 questions | 170,000 | 235,000 | 365,000 | 495,000 | 625,000 | 755,000 |
• The vertical axis represents "Questions" and the horizontal axis represents "Number of Screenings." The unit is yen.
• The above prices do not include tax.
Samples fee
| Questions/ Number of Completes |
100 | 200 | 200 | 400 | 500 | 700 | 800 | 700 | 700 800 | 1,000 |
|---|---|---|---|---|---|---|---|---|---|---|
| ~3 questions | 85,000 | 90,000 | 95,000 | 100,000 | 105,000 | 110,000 | 115,000 | 120,000 | 125,000 | 130,000 |
| ~6 questions | 145,000 | 155,000 | 165,000 | 175,000 | 185,000 | 185,000 | 205,000 | 215,000 | 225,000 | 235,000 |
| ~9 questions | 180,000 | 195,000 | 210,000 | 225,000 | 240,000 | 255,000 | 270,000 | 285,000 | 300,000 | 315,000 |
| ~12 questions | 215,000 | 235,000 | 255,000 | 275,000 | 295,000 | 315,000 | 335,000 | 355,000 | 375,000 | 395,000 |
| ~15 questions | 250,000 | 275,000 | 300,000 | 325,000 | 350,000 | 375,000 | 400,000 | 425,000 | 450,000 | 475,000 |
| ~20 questions | 300,000 | 330,000 | 360,000 | 390,000 | 420,000 | 450,000 | 480,000 | 510,000 | 540,000 | 570,000 |
| ~25 questions | 345,000 | 380,000 | 415,000 | 450,000 | 485,000 | 520,000 | 555,000 | 590,000 | 625,000 | 660,000 |
| ~30 questions | 390,000 | 430,000 | 470,000 | 510,000 | 550,000 | 590,000 | 630,000 | 670,000 | 710,000 | 750,000 |
• The vertical axis represents "Questions" and the horizontal axis represents "Number of Screenings." The unit is yen.
• The above prices do not include tax.
Screening and Fieldwork Charges Include
Survey design and distribution and sampling
System usage fees
Results data (raw data format)
Optional Services
- Questionnaire Design
- up to 10 Qs: ¥150,000 (add ¥50,000 per 5 extra Qs)
- Data Processing (cleaning, GT, raw, CrossFinder2)
- ¥25,000 (up to 10 Qs), ¥30,000 (up to 20 Qs), +¥10,000 per 10 Qs
- Crosstabulation
- up to 10 Qs, 3 axes: ¥35,000
- Analysis & Reporting
- up to 10 Qs: ¥150,000 (add ¥50,000 per 10 Qs)
- Results Sharing / Meetings
- From ¥50,000 (based on headcount, location, etc.)
- Image Display (1–10 images free)
- ¥3,000 per image after that
- Video Display
- ¥40,000 per video
Optional fees vary based on survey content, conditions, and requirements.
Please consult with our sales team for a detailed quote. We are happy to propose a plan that fits your budget.
Our experienced researchers will provide full support and propose the best research plan.
*Some types of official accounts may not be supported.