
Horizontal data is a data structure in which different items are placed in rows and columns, and information is represented by the correspondence between the rows and columns.
For example, in the following example of sales data of a supermarket, the rows contain items to be aggregated such as "sales," "gross profit," and "gross profit margin," and the columns contain items indicating the year and the month. Corresponding to these items, data is stored in the form of "Sales" in the second row × "January 2022" in the second column = "Sales in January 2022.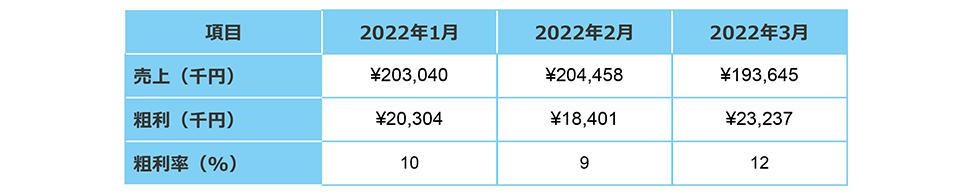
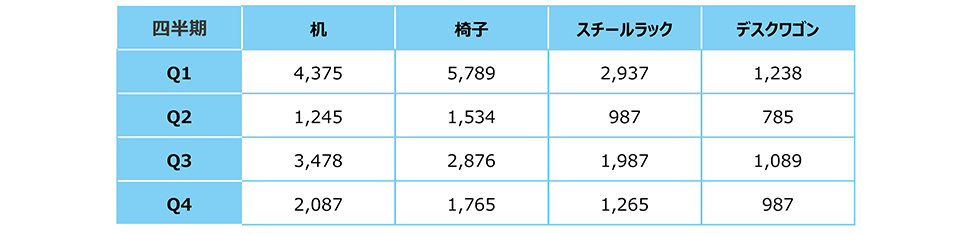
The following is an example of a company's quarterly sales of office supplies, shown horizontally. In this example, the rows contain the period items and the columns contain the product category items, and the matrix is switched from the previous example.
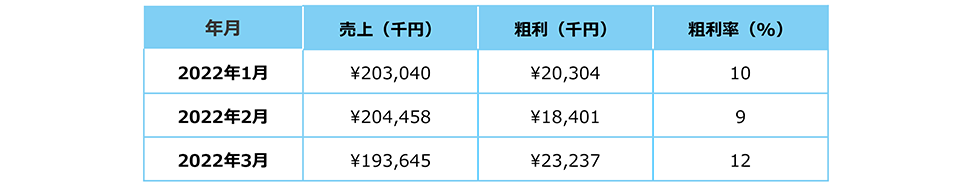
Vertical data, on the other hand, is in a format in which corresponding data is added vertically to items arranged in columns. For example, in the example of the supermarket sales data shown in the previous section, items such as "year, month," "sales," "gross profit," and "gross profit margin" are arranged in columns, and the information corresponding to each column is stored from the second row.
Also, the quarterly sales numbers for office supplies for the same company mentioned earlier are shown below in a vertical holding format. Here, too, items such as "Product," "Quarter," and "Sales Quantity" are arranged in columns, and the corresponding information is stored in the second and subsequent rows.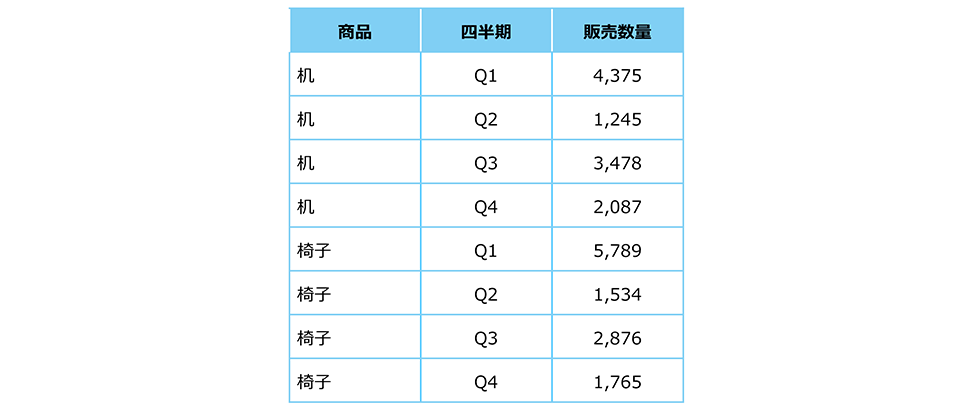
An item-by-item comparison of the characteristics of the vertical and horizontal holding formats is shown below.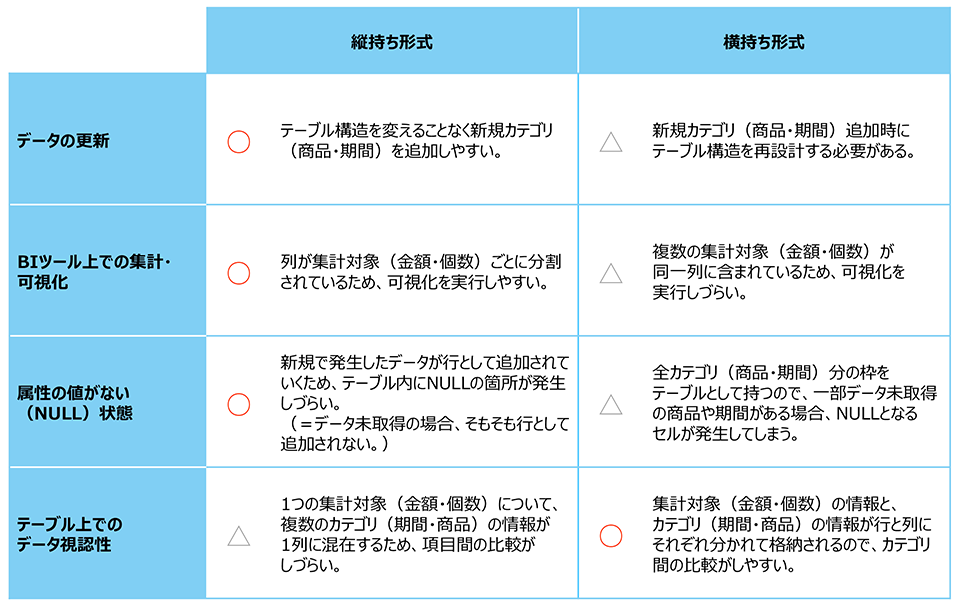
As can be seen from the above comparison, when handling data for management and aggregation in a database or BI tool, the basic "vertical" format is more suitable for easy updating and aggregation. On the other hand, when data is output for comparison by product or time period axis, "horizontal data" is recommended due to its superior visibility.
It is advisable to decide which structure to use for storing and managing data after imagining the situations in which the data will be handled.
We have looked at the difference between "vertical" and "horizontal" formats, and we hope you have understood that the vertical format is more suitable for management and tabulation on a database or BI tool.
The issue that tends to become a challenge when taking this into consideration is the conversion of survey data into databases and BI tools. As shown below, general survey data is in a horizontal format, with respondent sample numbers in the rows and answered question numbers in the columns, and response values are stored in a matrix correspondence. As explained so far, it is rather difficult to handle this data format in a database or B-tool, and it is desirable to convert it to a vertical format.
Cross Marketing converts such survey data into a vertical format, and provides a full range of services, including the creation of BI dashboards that are ideal for tabulation and visualization.We can also handle data from surveys other than those conducted by our company, so please feel free to contact us if you have any questions about converting survey data into a database or implementing BI.
■Reference site:
https://newssdx.kcme.jp/tableau_beginner_data_vertical_horizon/
https://mathwords.net/yokomotitatemoti
https://qol-kk.com/wp2/blog/2021/08/02/post-2981/
http://navi.wingarc.com/drsum/post-97.html
https://manamina.valuesccg.com/articles/740
https://octopus.nehan.io/manual/3340
https://zenn.dev/mkz/articles/7420f168c35550